Key Takeaways
CEO Confidence dropped to 47 in Q2 2026, down 12 points from 59 in Q1, according to The Conference Board’s May 28 release. A reading below 50 means negative responses outnumber positive ones. Of the 141 CEOs surveyed, 47% said the economy is materially worse than six months ago — a near-sixfold surge from just 8% last quarter. Yet the S&P 500 hit fresh all-time highs the same week, exposing a striking gap between boardroom sentiment and Wall Street.
- CEO Confidence at 47 — lowest since Q4 2022, below the 50 line
- “Economy worse” responses at 47% — a 5.9x surge from 8% in Q1
- S&P 500 record highs on May 27 vs boardroom pessimism, widening gap
- Capex intentions rose to 37% — AI and infrastructure spending intact
Forty-seven. Down twelve points in a single quarter. The Conference Board Measure of CEO Confidence dropped to that level in Q2 2026, breaking through the 50 line that separates pessimism from optimism for the first time since late 2022.
The same week, the S&P 500 carved out a fresh all-time high. Boardroom dread and Wall Street euphoria pulled apart in opposite directions, and the spread tells a story worth unpacking.
CEO Confidence at 47 — what the 50 line breaking means
The Conference Board’s CEO Confidence index for Q2 2026 came in at 47, down from 59 in Q1. That is a twelve-point drop in a single quarter. A reading below 50 signals that negative responses now outnumber positive ones across the surveyed pool.
The print is the lowest since Q4 2022 — the depth of the Fed’s most aggressive hiking cycle, when recession fears peaked. The Q2 2026 sample includes 141 CEOs, with responses collected from May 4 through 18. The Conference Board singled out leaders of large firms as the cohort whose optimism plunged the hardest.
This is a diffusion index, which tracks the direction of response distribution rather than averages. In short, what matters is not the absolute level but the threshold and the slope. When the index pierces 50 from above, it has historically preceded a tonal shift in hiring and capital allocation over the following six to twelve months.
The 5.9x surge in “economy is worse” — distribution has moved
The most striking figure in the release is not the headline number but the underlying distribution shift. CEOs who said the economy is materially worse than six months ago jumped to 47%, roughly 5.9 times the 8% from the prior quarter. On the other side, those who said conditions improved fell from 39% to 15%, less than half.
The forward outlook moved in lockstep. CEOs expecting improvement over the next six months dropped from 43% to 24%, while those expecting deterioration tripled from 13% to 40%. Same survey panel, same questions, three months apart — and the distribution has effectively flipped.
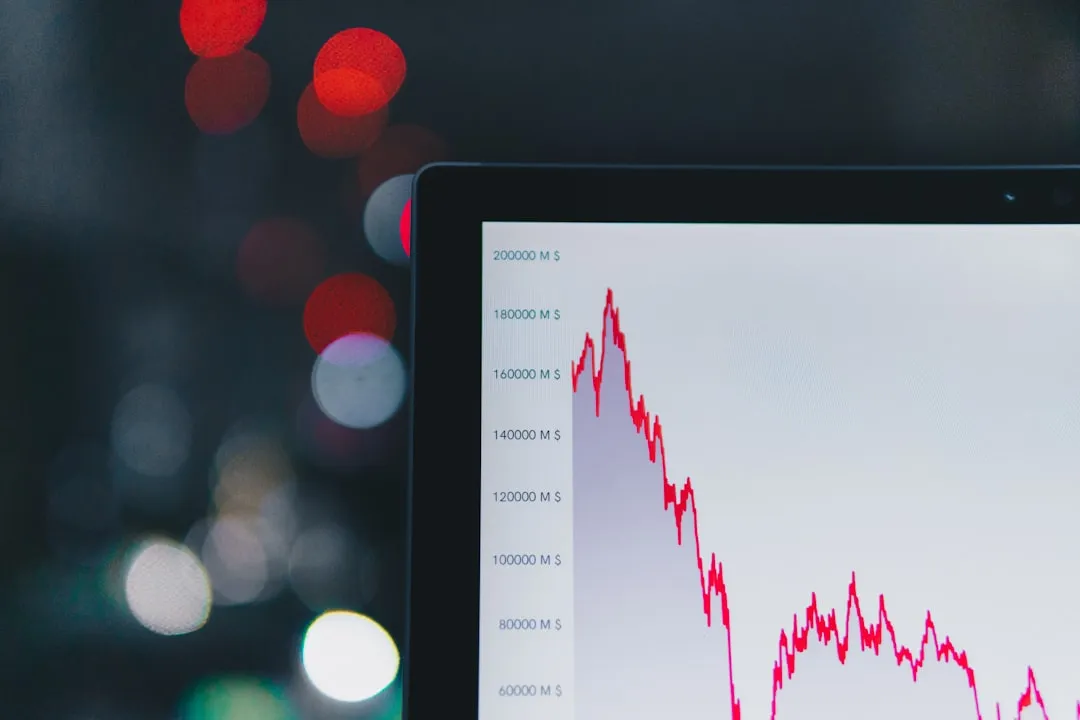
S&P 500 at record highs — three indicators, three directions
While the boardroom turned negative, the market did the opposite. The S&P 500 and Nasdaq Composite both notched fresh all-time highs on May 27, climbing 0.5% and 0.6% respectively. CEOs were filling out their pessimistic surveys the same week the index was setting records.
Consumer Confidence sits in the middle. The Conference Board’s monthly print for May came in at 93.1, down only 0.7 points and still above where it stood in January. Three indicators, three directions: boardroom pessimistic, Main Street steady, Wall Street euphoric.
The key here is what each indicator actually measures. CEO Confidence asks about intent over the next twelve months on hiring and investment, while the S&P 500 reprices mega-cap earnings expectations, liquidity conditions, and policy bets in real time. When these gauges decouple, one side usually pulls toward the other — and historical episodes suggest the intent gauges tend to seep into equity prices with a lag rather than the reverse.
Hiring and capex — “low-hire, low-fire” hardens
The labor signal tilted one way. CEOs planning to reduce headcount over the next twelve months rose to 31% from 27% in Q1, while those planning to expand staffing fell from 31% to 28%. Both moves are single-digit, but the direction is unambiguous.
The puzzle sits in capital spending. The share of CEOs intending to increase capex over the next twelve months rose from 35% to 37%, while only 8% expect to cut spending. Pessimism about the economy did not translate into a retrenchment of capital outlays.
Put simply, the “low-hire, low-fire” pattern has hardened. Companies are reluctant to add bodies but equally reluctant to fire en masse, while keeping the AI and infrastructure investment cycle running. The takeaway: rising capex no longer flows straight into labor demand the way it used to.

The three pressure points — Iran, tariffs, inflation
The pessimism has three drivers running in parallel, and the biggest is the Iran situation dragging on. After fresh US strikes on May 27, WTI for July rose to $90.65, up 2.22%, while Brent for July climbed to $96.29, up 2.12%. The energy cost channel reopened just as boardrooms were filling out their Q2 surveys — broader context covered in our Iran ceasefire and Brent +55% analysis.
The second is tariffs. The Tax Foundation puts the average US tariff on Chinese goods at 47.5%, roughly 15 times the 3.1% in place before Trump’s first term. The same analysis estimates an average household burden of $1,500 per year, and the operational drag has shown up clearly in cases like our $127B tariff refund backlog coverage.
The third is inflation. The European Commission lifted its 2026 Eurozone inflation forecast to 3.0% from 1.9%, while JP Morgan now pegs US core CPI at 3.2%. In other words, energy, tariffs, and prices all moved in the same direction within a single quarter, and CEOs were the cohort that registered the combined hit first.
Top risks — cyber, geopolitics, AI all up
The biggest shift in this survey is in risk perception. Cyber risk now ranks as a top concern for roughly two-thirds of CEOs surveyed, the largest single-quarter increase among the tracked risk categories. It is the standout move in the Q2 data.
Geopolitical risk and AI-and-new-technology risk both held their elevated positions. The Iran and Middle East situation kept geopolitics near the top, and AI surfaced as a dual burden: adoption pressure on one side, security exposure on the other. The combined effect is that three distinct risks now compete for budget and attention, complicating capex prioritization.
In other words, the reason CEOs cannot cut spending despite the pessimism is structural. A single cyber incident can damage a company beyond recovery, lagging on AI risks losing ground to peers, and geopolitics forces supply chain rewrites that have a cost of their own. Confidence at 47 and capex at 37% intentions coexist because the risk landscape leaves no easy line to cut.
Investor playbook — what to track from here
For investors, the 47 print carries two distinct signals. One side flags weakening US consumer-discretionary and travel demand if CEO pessimism filters into household budgets, while the other side suggests AI infrastructure, power, and semiconductor capital equipment demand stays intact thanks to the 37% capex intentions. Both signals appeared in the same quarter.
Three data points should be on every watchlist. First, the June Fed FOMC guidance and the dot plot revision; second, whether WTI holds above $90 for a sustained stretch rather than briefly spiking. Third, whether the Conference Board’s next quarterly CEO Confidence print extends the slide below 47 or rebounds.
The takeaway: the inflection point that decides which side of the boardroom-versus-market gap closes first lands squarely between the June FOMC and the next CEO Confidence print. Until then, the divergence is the story.
Q1. Why does CEO Confidence at 47 matter?
The Conference Board CEO Confidence index is a diffusion gauge built around the 50 line: above means positive responses outweigh negative, below means the reverse. Q2 2026 at 47 marks a break below that line, and the 12-point fall from 59 in Q1 takes the index to its lowest level since Q4 2022. Most large-firm CEOs now report a materially worse economy than six months ago, and that read tends to lead hiring and capital allocation decisions in the following quarters.
Q2. Why is the S&P 500 still hitting record highs?
The index is dominated by a handful of mega-cap names in AI and semiconductors, so headline performance can run far ahead of average-company conditions. Confidence asks about twelve-month intent, while equity prices reprice earnings expectations, liquidity, and policy bets in real time. When the two diverge, history suggests fundamental indicators tend to pull on prices with a lag rather than the other way around.
Q3. What should US-focused investors do with this read?
Treat the 47 print as a leading signal rather than a confirmed verdict. The capex intent at 37% supports continued strength in AI infrastructure, power, and semiconductor capital equipment, while the hiring slowdown adds downside risk to discretionary consumer and travel demand. Tracking Iran, tariffs, and inflation as a combined block — rather than as separate stories — is the practical takeaway.
Iran Ceasefire Extended: S&P 500 Dips as Brent Rallies 55%
$127B Tariff Refund: 56,497 Importers Hit CAPE Glitches
References
- PR Newswire / Conference Board (2026-05-28) — CEO Confidence Q2 2026 at 47, down 12 points from 59
- Conference Board CEO Confidence (2026-05-28) — 141 CEOs surveyed May 4–18, lowest reading since Q4 2022
- Conference Board (2026-05-28) — 47% “economy worse” (5.9x of prior 8%), 15% “better” (down from 39%)
- Conference Board (2026-05-28) — Six-month outlook: 40% expect deterioration, 24% improvement
- Conference Board (2026-05-28) — Capex intentions 37% (up from 35%), only 8% plan cuts; layoffs 31%, hiring 28%
- Conference Board (2026-05-28) — Cyber risk ranked top by ~two-thirds of CEOs; geopolitics and AI remain elevated
- CNBC (2026-05-27) — S&P 500 +0.5%, Nasdaq +0.6% — both at fresh all-time highs
- CNBC market update (2026-05-27) — WTI July at $90.65 (+2.22%), Brent July at $96.29 (+2.12%)
- Conference Board Consumer Confidence (2026-05-26) — Consumer Confidence at 93.1 in May, down only 0.7 points
- Tax Foundation (2026-05-15) — Average US tariff on Chinese goods at 47.5%, household burden ~$1,500/year
- JP Morgan / European Commission (2026-05-15) — Eurozone 2026 inflation outlook 1.9% → 3.0%, US core CPI seen at 3.2%
Stay Ahead of the Curve
Get the latest insights on AI, tech, and markets — delivered in both Korean and English.

Jugger | Backend Developer
A backend engineer working in enterprise solutions software since June 2021. The hands-on perspective from system design, API implementation, and production operations directly informs this site’s
AI, IT, and cloud infrastructure coverage.
For topics outside direct professional experience—blockchain and macroeconomics—analysis is built on primary-source citations such as SEC filings, whitepapers, institutional research, and government
statistics. Speculation is clearly separated from verified fact, and unverified claims are not published.
AI tools assist with drafting, but every article is reviewed, revised, and verified before publication. Errors are corrected with visible notes when discovered.
Contact: jjunggulee@gmail.com