- Dated Brent crude hit $141.36 — the highest price since the 2008 financial crisis, with a $32.33 gap between spot and futures masking the true severity of the supply crunch
- U.S. gasoline topped $4.018 per gallon for the first time since 2022, costing Americans an extra $8.4 billion since the war began — low-income households spend 18.3% of wages on fuel
- Goldman Sachs raised recession odds to 30%, EY-Parthenon to 40% — the S&P 500 worst-case scenario sits at 5,400 (a 22% drop from the January peak)
$141.36. That is the price of a barrel of Brent crude in the spot market — the highest oil prices have reached since the 2008 financial crisis. The Strait of Hormuz blockade has cut off roughly 20% of the world’s daily oil supply, and the shockwaves are now rippling from gas stations to grocery aisles to Wall Street trading floors.
This is not a run-of-the-mill price spike. Goldman Sachs has raised its 12-month U.S. recession probability to 30%, while the Federal Reserve finds itself trapped between inflation that refuses to cool and an economy that cannot afford higher rates much longer.
The numbers are stark, the timeline uncertain, and the impact deeply unequal. Here is what the worst energy crisis in 18 years means for your portfolio, your household budget, and the broader economy.
$141 Brent Crude: The Highest Oil Prices Since 2008
On April 2, Dated Brent — the benchmark for actual physical oil cargo deliveries — surged to $141.36 per barrel, according to S&P Global. It was the highest price recorded since the 2008 financial crisis. On the same day, West Texas Intermediate (WTI), the U.S. benchmark, broke through $111 per barrel.
The key here is the divergence between spot and futures markets. While Dated Brent hit $141, the June futures contract settled at just $109.03 — a gap of $32.33. Energy analysts warned that the futures market was providing “a false sense of security,” effectively masking the true tightness that physical markets were already reflecting.
Goldman Sachs called the current situation a “physical scarcity of barrels” unlike anything the market has seen in decades. The bank estimated that the war premium alone accounts for $25 to $40 per barrel and flagged a tail risk scenario where prices could reach $150 if additional supply disruptions occur.

The Hormuz Blockade: A 20% Supply Shock
The Strait of Hormuz is one of the most critical chokepoints in global energy infrastructure, carrying approximately 20% of the world’s daily oil supply and a comparable share of liquefied natural gas. Within the first week of the blockade, tanker traffic through the strait plummeted by 90%, delivering an immediate jolt to global energy supply chains.
The International Energy Agency (IEA) responded on March 11 with the largest emergency reserve release in its history. All 32 member countries agreed to release 400 million barrels of oil into the global market — a response unprecedented in both scale and speed.
The 400 million barrels proved insufficient. Even after the historic release, oil prices continued climbing to $141, demonstrating that the current supply deficit exceeds what strategic reserves can realistically bridge. Alternative shipping routes exist but add significant transit time and cost, making them an imperfect substitute for the most efficient maritime corridor in the oil trade.
The ripple effects reached Asia within days. Thailand and India implemented fuel rationing programs, while refined product inventories in Singapore and Mumbai dropped to critical levels. The crisis exposed how deeply interconnected the global energy supply chain remains — and how quickly one choked waterway can cascade into continent-wide shortages.
49% Recession Odds: The Model That’s Never Been Wrong
$4 Gas and the Squeeze on American Wallets
The national average gasoline price in the United States hit $4.018 per gallon, the highest since August 2022. The surge was dramatic — a $1.04 increase in a single month, directly tied to the Hormuz supply disruption feeding through to refined product markets.
Since the war began, Americans have spent an extra $8.4 billion on gasoline alone. That is $8.4 billion pulled from restaurant visits, electronics purchases, home improvement projects, and every other category of discretionary spending. Consumer traffic in non-essential retail has declined visibly.
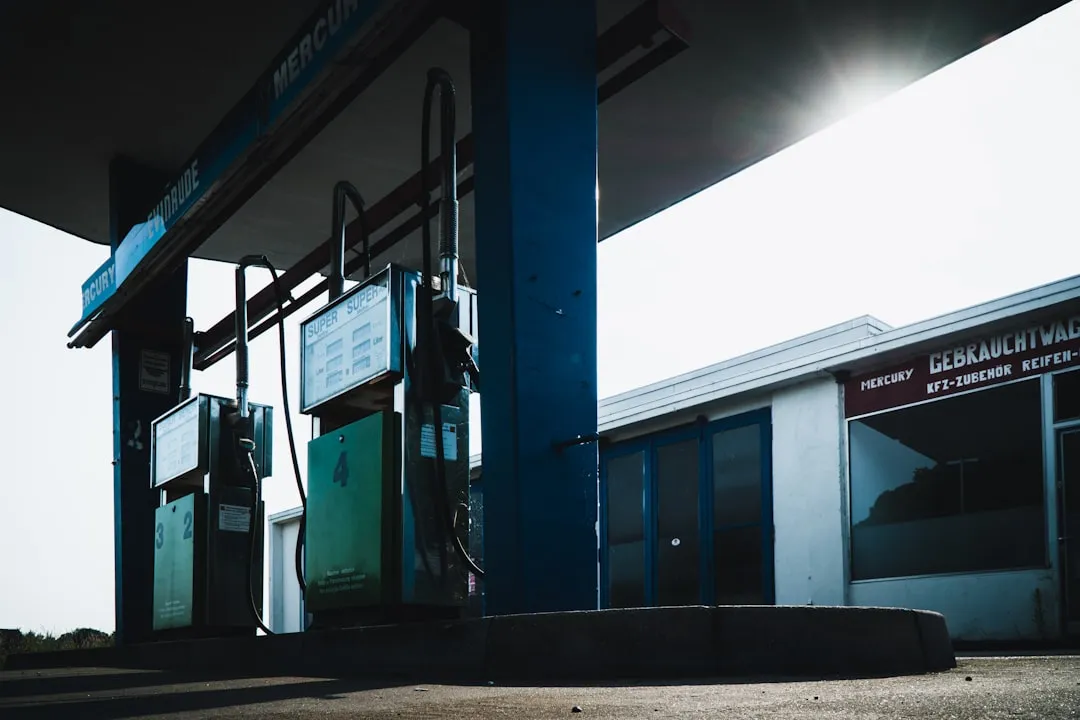
The pain at the pump is only the beginning. Diesel prices climbed to $5.45 per gallon, pushing up costs across the entire supply chain.
Farm equipment runs on diesel, and so do the long-haul trucks that carry food from farms to supermarkets. Food-at-home inflation jumped 0.4% in a single month as a direct result.
Logistics companies are scrambling to keep up. UPS now adjusts its fuel surcharges on a weekly basis to track diesel prices, and Amazon announced a new 3.5% fuel and logistics surcharge on third-party sellers using its fulfillment network, effective April 17. In short, the oil shock is no longer confined to the energy sector — it is flowing into every corner of the consumer economy.
The K-Shaped Economy: Low-Income Households Bear the Brunt
The most uncomfortable truth about this oil shock is that it does not hurt everyone equally. Households in the lowest income quintile spend 18.3% of their wages on gasoline — more than double the national average of 7.7%. For these families, every dollar added at the pump comes directly out of groceries, childcare, or other essentials.
The other side of the equation is equally telling. The top 10% of income earners account for nearly half of all consumer spending in the U.S. economy. With consumer spending representing 68% of GDP, the relative insulation of wealthy households is effectively the last line of defense against a full consumer spending collapse.
Put simply, this year’s tax refund season was supposed to deliver an additional $60 billion back to American households. The oil price surge has “almost exactly” offset that amount. For lower-income families, rising fuel costs function as a stealth tax on wages — one that no legislation authorized and no ballot approved.
The implications for GDP growth are direct. Consumer spending is the engine that powers 68% of the American economy, and when the bottom half of earners pulls back, the drag on growth intensifies. Goldman Sachs cutting its 2026 GDP forecast to 2.1% and labeling the second half as “stall speed” reflects this deepening consumer divide.
US Jobs Report: 396K Quit Searching, Hiring at Decade Low
Wall Street’s Warning: 30-40% Recession Odds
Goldman Sachs raised its 12-month U.S. recession probability from 20% to 30% in late March. The bank trimmed its full-year 2026 GDP growth forecast to 2.1%, with second-half growth projected at just 1.25% to 1.75% — a range the firm describes as “stall speed,” the economic equivalent of an airplane barely generating enough lift to stay airborne.
EY-Parthenon went further, pegging recession odds at 40% by accounting for cascading infrastructure effects that ripple beyond the direct energy price impact. The consulting firm argued that second-order effects — supply chain disruptions, reduced capital expenditure, and tightening credit conditions — could accelerate the downturn beyond what headline oil prices alone suggest.

Goldman’s equity strategists painted an even bleaker picture for stock markets. In a scenario of persistent oil supply disruptions, the S&P 500 could fall to 5,400 — a 22% decline from its January peak of 6,979, which would push the index into bear market territory.
The takeaway: the energy price shock is not just a commodity story. It threatens to trigger a classic feedback loop — higher prices squeeze consumers, weakened consumption hits corporate earnings, and deteriorating earnings lead to layoffs. The question is no longer whether this oil shock will affect growth, but how deep the damage will run.
Inflation Reignited: The Fed’s Impossible Dilemma
The Federal Reserve held its benchmark rate at 3.50-3.75% at the March meeting, a widely expected decision. More telling was the upward revision to inflation projections: core PCE (Personal Consumption Expenditures, which excludes volatile food and energy prices) was raised from 2.5% to 2.7%, acknowledging that energy costs were bleeding into broader goods and service prices.
Goldman Sachs projects that headline PCE — the broader measure including food and energy — will reach 3.1% by December 2026. The OECD went further, forecasting U.S. inflation at 4.2% for 2026, a sharp jump from the 2.68% average recorded in 2025. Three separate institutions are now sounding the same alarm: inflation is accelerating, not decelerating.
Why this matters: the rate cut timeline has been completely upended. Goldman Sachs withdrew its June cut forecast and now expects the first 25-basis-point reduction in September, followed by a second in December. The logic is straightforward — as long as oil pushes prices higher, the Fed has no justification for easing monetary policy.
The OECD’s 4.2% forecast, if realized, would represent a 1.5-percentage-point surge from 2025 levels. The gap to the Fed’s 2% target would more than double, leaving policymakers with vanishingly little room to maneuver between supporting growth and containing prices.
Oil driving up inflation, inflation preventing rate cuts, and elevated rates suppressing consumption — this circular trap is now the defining feature of the 2026 macroeconomic landscape. Goldman pushing its first cut to September signals that this cycle will not break quickly.
$80 or $150: Where Oil Prices Go From Here
Goldman Sachs’ base case is Brent crude at $80 by year-end. This scenario assumes the Hormuz blockade resolves within roughly six weeks. Even under this optimistic timeline, April prices are expected to average $115 per barrel, with a gradual decline through the second half of the year.
The alternative is far less comforting. If the blockade drags on or the conflict escalates further, Goldman warns that additional supply disruptions could push Brent to $150. The Energy Select Sector SPDR Fund (XLE) has already surged 33% year-to-date, suggesting that the market is beginning to price in a prolonged period of elevated oil prices rather than a quick resolution.
The divergence between these two scenarios is enormous — the difference between a bruised but functional economy and a full-blown recessionary spiral. For investors, the XLE’s 33% rally reflects one bet. For consumers, the $141 spot price reflects another reality entirely.
The pivot point between $80 and $150 rests on two variables: how quickly the Hormuz blockade is resolved, and whether the conflict expands beyond its current scope. Investors and consumers alike should track the Brent spot-futures spread and the pace of IEA strategic reserve releases as the two most reliable real-time indicators of which scenario is unfolding.
References
- CNBC / S&P Global (2026-04-02) — Dated Brent crude hit $141.36, highest since 2008 financial crisis
- CNBC (2026-04-02) — Spot-futures gap of $32.33, June futures at $109.03
- CNBC (2026-03-31) — U.S. gasoline at $4.018/gallon, $1.04 surge in one month
- Fortune (2026-04-02) — Americans spent extra $8.4B on fuel, lowest-income households spend 18.3% of wages on gas
- Wikipedia / IEA (2026-03-11) — IEA’s 32-nation, 400-million-barrel emergency reserve release; tanker traffic down 90%
- Dallas Fed (2026-03-20) — Strait of Hormuz carries approximately 20% of global daily oil supply
- Fortune (2026-03-25) — Goldman Sachs recession probability at 30%, GDP forecast 2.1%, headline PCE 3.1%
- Reuters / Investing.com (2026-04-01) — Goldman Sachs S&P 500 worst case at 5,400 (−22% from January peak)
- Federal Reserve (2026-03-18) — Fed holds rates at 3.50-3.75%, core PCE raised to 2.7%
- FinancialContent (2026-04-06) — WTI past $111, XLE up 33% YTD, war premium $25-40 per barrel
Stay Ahead of the Curve
Get the latest insights on AI, tech, and markets — delivered in both Korean and English.

Jugger | Backend Developer
A backend engineer working in enterprise solutions software since June 2021. The hands-on perspective from system design, API implementation, and production operations directly informs this site’s
AI, IT, and cloud infrastructure coverage.
For topics outside direct professional experience—blockchain and macroeconomics—analysis is built on primary-source citations such as SEC filings, whitepapers, institutional research, and government
statistics. Speculation is clearly separated from verified fact, and unverified claims are not published.
AI tools assist with drafting, but every article is reviewed, revised, and verified before publication. Errors are corrected with visible notes when discovered.
Contact: jjunggulee@gmail.com