- Moody’s Analytics put recession odds at 48.6% — nearly three times the historical baseline of 15–20%, and just 1.4 points from becoming the base case
- Goldman Sachs raised its own probability to 30% (from 25%), cut GDP growth to 2.1%, and lifted PCE inflation to 3.1% — all in the same research note
- February payrolls came in at –92,000 (consensus: +60,000), unemployment rose to 4.4%, and the BLS retroactively confirmed five months of job losses in 2025 — the first such streak since 2010

Negative ninety-two thousand. That was February’s payroll print — a number that landed 152,000 jobs below consensus and stripped the “resilient labor market” narrative down to its bones. Three weeks later, Moody’s Analytics put recession odds at 48.6%, and Goldman Sachs raised its own estimate to 30%.
Both revisions arrived on March 25, independently. When two institutions running different models and different methodologies reach higher recession probabilities on the same morning, the signal is harder to dismiss as noise. What follows is a data-by-data breakdown of how the U.S. economy arrived at this threshold.
Moody’s 48.6%: Recession Odds That Are Almost a Coin Flip
Moody’s Analytics typically sets its baseline recession probability between 15% and 20%. At 48.6%, the current reading is nearly three times that baseline — statistically, it sits 1.4 percentage points below the level at which recession becomes the official base case. The practical implication: a model that has been reliably conservative for decades is now telling markets that the downside scenario is nearly as likely as no recession at all.
Mark Zandi, chief economist at Moody’s Analytics, framed the problem with unusual directness. “Even before the conflict, I thought recession risks were on the rise,” he told Fortune.
The current geopolitical disruption is amplifying an underlying fragility that had already been building. Zandi went further: “Recession risks are very high — and unless the hostilities are coming to an end now, I think recession is more than likely by the second half of the year.”
“More than likely by the second half of the year” is not hedged analyst language. It places the probability above 50% within the next two to three quarters — a timeline that forces any serious investor to re-examine their positioning. The 48.6% figure is the formalized version of that call; the verbal guidance suggests the model may already be moving higher.
The distance between 48.6% and 50% matters more than the raw number. Below 50%, risk assets can still price in a soft-landing premium.
Above 50%, the base case tilts negative, and the market pricing convention shifts accordingly. Moody’s making this number public is not a routine update; it is a calibration event for how financial markets think about the probability-weighted value of growth-sensitive assets.
Goldman Sachs at 30%: The Base Case Is Bending
Goldman Sachs raised its 12-month U.S. recession probability from 25% to 30% in the same March 25 research note that included two additional downward revisions. Annual GDP growth was cut to 2.1%. The December PCE inflation forecast — the Fed’s preferred price gauge — was lifted by 0.2 percentage points to 3.1%.
Goldman’s base case remains economic slowdown, not contraction. But the direction of revision matters as much as the absolute level.
A firm that had been at 25% moving to 30% is not calling a recession; it is telling clients that the probability distribution is shifting toward the tail. When the same firm simultaneously cuts growth and raises inflation, the implicit message is that the Fed cannot ride to the rescue without making the inflation problem worse.
The Goldman oil price scenario adds a concrete stress-test backdrop. Assuming roughly six weeks of Strait of Hormuz supply disruption, the firm sees Brent at $105 in March, $115 in April, and a recovery toward $80 by year-end.
As of March 27, Brent had already crossed $110, meaning the April forecast is the next near-term test. If oil holds above $110 through mid-April, the full-year GDP and PCE assumptions in Goldman’s base case will need further revision.

February’s Payroll Shock: The Number Nobody Wanted
February nonfarm payrolls came in at –92,000, versus a consensus estimate of +60,000. The 152,000-job miss is not a rounding error; it is a directional reversal of a forecast that had the labor market adding jobs. Unemployment rose to 4.4% from 4.3% the prior month, and the labor force participation rate dropped to 62%, suggesting some workers stopped looking entirely.
The Bureau of Labor Statistics (BLS) compounded the headline shock with revisions to prior months. January payrolls were cut from 130,000 to 126,000, and December was revised from +50,000 to –17,000 — a 67,000-job swing that turned a month of modest gains into outright contraction.
Taken together, the revisions confirmed that the U.S. economy shed jobs in five separate months of 2025, the first time that has happened since 2010. Five months of job losses in a single calendar year, ratified by official BLS data, is a labor market signal of a different category than a single weak print.
Seema Shah, chief strategist at Principal Asset Management, put it precisely: “Recent labor market data had been pointing to resilience, but today’s sharply weaker reading raises the risk that a different picture could be in play.” The word “different” is doing a lot of work in that sentence. A market that priced in labor market resilience will now have to reprice the probability that the resilience was a lagging signal, not a leading one.
The unemployment rate reaching 4.4% is meaningful beyond the single data point. Three years ago, unemployment stood at 3.4% — a 1.0 percentage point increase that, combined with five months of confirmed job losses in 2025, forms a deterioration pattern the labor market has not shown since 2010.
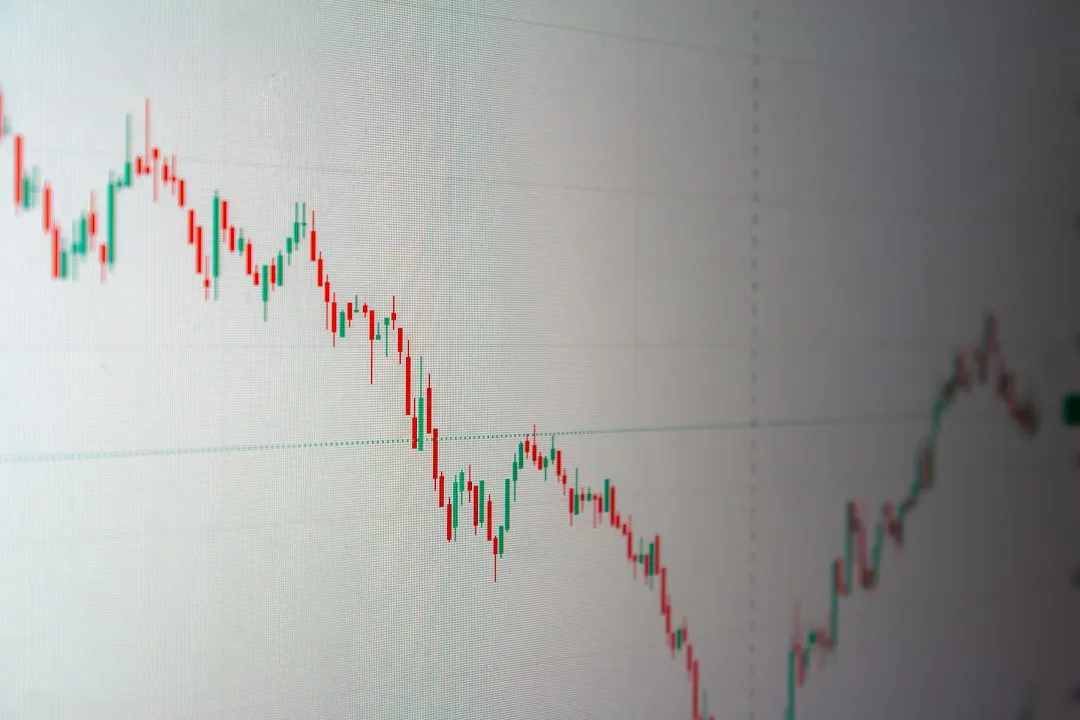
Oil at $110 and the Inflation Feedback Loop
Goldman’s three-month oil price path — $105 in March, $115 in April, $80 by year-end — is built on a supply disruption assumption, not a demand surge. The difference matters for inflation dynamics. A supply-driven oil spike does not reflect economic strength; it reflects a cost shock that hits consumers and producers simultaneously, compressing margins without generating the revenue growth that would normally cushion the hit.
Brent crude crossed $110 on March 27, meaning Goldman’s March estimate has already been met and the trajectory toward $115 in April is now the live scenario. The Fed’s preferred inflation metric, PCE (Personal Consumption Expenditures, the price index the Federal Reserve targets), was already revised upward by the Fed itself to 2.7% at the March FOMC. Goldman’s separate PCE estimate for December sits at 3.1% — a full 0.4 points above the Fed’s own March forecast.
The arithmetic consequence is straightforward. If energy prices hold at current levels through April, the PCE path for the remainder of the year will be materially above any scenario the Fed published at its most recent meeting. A central bank that was already holding rates steady — not cutting — will find itself further behind on the inflation side of its dual mandate, even as the jobs data deteriorates on the growth side.
Strait of Hormuz Blocks $104 Oil and Breaks Global Trade
The Fed’s Impossible Dilemma: Rates, Inflation, and Slowing Growth
The Federal Reserve held the federal funds rate at 3.5%–3.75% at its March FOMC meeting. Simultaneously, it raised its PCE inflation forecast from 2.4%–2.5% to 2.7% — a revision that, in the context of an already-elevated rate environment, effectively tells markets that rate cuts are not imminent. The word “simultaneously” is the problem: the Fed tightened its inflation outlook and held its policy rate in the same meeting, which is exactly the configuration that prevents it from responding to weakening growth data with easier policy.
The dilemma is structural: cutting rates now would risk re-accelerating inflation just as energy prices are pushing PCE toward 3.1%. Holding rates in the face of –92,000 payrolls and a 4.4% unemployment rate means allowing labor market deterioration to deepen without a monetary policy offset.
There is no clean exit from this configuration — only a choice between two different types of policy error. The rate hold at 3.5%–3.75% alongside a higher PCE forecast is the documented outcome of that constraint.
GDP growth at 2.1% is not recessionary on its face — the economy is still growing. But 2.1% nominal growth paired with PCE inflation at 3.1% compresses real purchasing power, leaving little cushion if growth weakens further.
A central bank that cannot cut into a slowing economy because inflation is running hot is a central bank with its toolkit constrained at precisely the wrong moment. That is the documented position the Fed finds itself in after its March FOMC.
The May FOMC meeting and its accompanying dot plot (the Fed’s summary of economic projections, showing where each policymaker expects rates to be) is now the most important near-term data point for markets. If the median dot shifts to fewer cuts — or no cuts — for 2026, it will confirm that the Fed views inflation as the dominant risk, regardless of what the labor market is doing. That confirmation would likely push recession odds higher at both Moody’s and Goldman.
Five Indicators, One Direction
The argument for treating current conditions as a genuine inflection point rests not on any single data point but on the simultaneous deterioration across five independent indicators. When separate economic signals converge, the probability that any one of them is a statistical outlier declines sharply.
- Recession probability: Moody’s at 48.6%, Goldman Sachs at 30% — both upgraded simultaneously on March 25
- Labor market: February payrolls –92,000, unemployment 4.4%, five months of job losses in 2025 (first since 2010), labor participation at 62%
- Equity markets: S&P 500 logged five consecutive weekly losses through March 27 — the longest weekly losing streak since 2022
- Energy: Brent crude above $110 as of March 27, Goldman’s April forecast at $115
- Growth and inflation: GDP forecast cut to 2.1%, PCE lifted to 3.1% — the stagflation configuration
Each indicator draws on a different data source and reflects a different economic actor: institutional forecasters, the Bureau of Labor Statistics, equity market pricing, commodity markets, and the Fed’s own projections. A world in which all five move in the same adverse direction within the same two-week window is not a world of random noise; it is a world in which the underlying trajectory has shifted.
The critical nuance is that 48.6% recession odds still leave a 51.4% probability of no recession. The five-indicator convergence does not predict an outcome — it documents a distribution that has tilted meaningfully toward the downside. For investors and consumers, the implication is not panic; it is a recalibration of expected value calculations.

What Investors and Consumers Should Watch
For investors, the near-term decision framework centers on two variables: the trajectory of Brent crude relative to Goldman’s $115 April forecast, and the May FOMC dot plot. If Brent holds above $110 through mid-April, Goldman’s full-year oil and PCE forecasts will need upward revision — and its recession probability estimate will likely follow. If the dot plot shows the median 2026 rate expectation rising (or cut projections being removed), it confirms that the Fed has effectively abandoned the option to cushion a slowing economy with easier monetary policy.
For consumers, the actionable signal from 48.6% recession odds is not to liquidate assets but to build buffer. A 48.6% probability environment is the kind of environment where emergency funds, fixed-cost rationalization, and debt structure review deliver asymmetric value. The cost of being prepared if a recession materializes is lower than the cost of being unprepared if it does.
Two specific numbers belong on every watchlist. The March payroll report — due in April — will reveal whether February’s –92,000 print was a one-month shock or the beginning of a trend consistent with the downward BLS revisions to 2025. The May FOMC’s PCE projection update will determine whether the Fed has room to pivot if the labor data continues to deteriorate, or whether inflation keeps the central bank sidelined while the economy weakens beneath it.
References
- Fortune (2026-03-25) — Moody’s Mark Zandi raises 12-month recession probability to 48.6%
- Fortune (2026-03-25) — Zandi: “Even before the conflict, recession risks were rising”; “more than likely by H2”
- Fortune (2026-03-25) — Goldman Sachs raises recession probability to 30%, cuts GDP to 2.1%
- Fortune (2026-03-25) — Goldman oil forecast: $105 (March), $115 (April), $80 (year-end); PCE 3.1%
- NBC News / BLS (2026-03-06) — February payrolls –92,000; unemployment 4.4%; labor participation 62%
- NBC News (2026-03-06) — BLS revisions: December –17,000; five months of job losses in 2025, first since 2010
- NBC News (2026-03-06) — Seema Shah (Principal Asset Management): “risk that a different picture could be in play”
- CNBC (2026-03-18) — Fed March FOMC: rate held at 3.5%–3.75%; PCE forecast raised to 2.7%
- Rio Times Online (2026-03-27) — S&P 500 five-week losing streak; Brent crude above $110
Stay Ahead of the Curve
Get the latest insights on AI, tech, and markets — delivered in both Korean and English.

Jugger | Backend Developer
A backend engineer working in enterprise solutions software since June 2021. The hands-on perspective from system design, API implementation, and production operations directly informs this site’s
AI, IT, and cloud infrastructure coverage.
For topics outside direct professional experience—blockchain and macroeconomics—analysis is built on primary-source citations such as SEC filings, whitepapers, institutional research, and government
statistics. Speculation is clearly separated from verified fact, and unverified claims are not published.
AI tools assist with drafting, but every article is reviewed, revised, and verified before publication. Errors are corrected with visible notes when discovered.
Contact: jjunggulee@gmail.com