- Turkey’s central bank sold 131 tonnes of gold in March 2026 alone, cracking a three-year central bank gold rush that had propelled prices above $5,000 per ounce.
- Global central bank gold purchases are projected to drop from 1,237 tonnes in 2025 to 750–850 tonnes in 2026, signaling a structural demand shift.
- J.P. Morgan maintains a Q4 2026 gold price target of $5,055, while Natixis warns of “downward pressure for the foreseeable future” — a split that mirrors the East-West divide among central banks.
Five thousand and eighty-eight dollars. That was the price of gold on January 26, 2026, when the metal breached $5,000 per ounce for the first time in history. Three years of relentless central bank buying had pushed the gold price to this milestone.
Three months later, the script flipped. Turkey dumped 131 tonnes in a single month, Russia cracked open its reserves to fund a war, and the gold price slid roughly 10% from the peak to around $4,838. The question now facing every portfolio manager and reserve strategist is straightforward: was this the end of the gold rush, or the beginning of the buy-the-dip trade of the decade?
The $5,000 Breakthrough and the Peak of the Gold Rush
Gold’s ascent in 2025 was historic by any measure. The metal surged 64% over the year — its best annual performance since 1979 — before carrying that momentum into early 2026 and hitting $5,088 per ounce on January 26. The $5,000 psychological barrier, once dismissed as a fringe forecast, fell almost casually.
Behind the rally sat an unprecedented wall of capital. Annual inflows into gold-backed exchange-traded funds (ETFs) reached $89 billion in 2025, the largest on record. Global gold ETF holdings climbed to 4,025 tonnes, and assets under management hit a record $559 billion.

The key here is the role central banks played. In 2025, official institutions purchased a combined 1,237 tonnes of gold — the third consecutive year above 1,000 tonnes. That amounted to roughly 32% of annual mine supply of approximately 3,900 tonnes, an absorption rate that left comparatively little metal for everyone else.
Turkey’s 131-Tonne Fire Sale: Defending the Lira at Any Cost
The first crack in the gold rush narrative came from Ankara. Turkey’s central bank sold 131 tonnes of gold in March 2026 alone — an extraordinary single-month liquidation. Nicky Shiels, head of metals strategy at MKS Pamp, observed that “there has been notable selling of gold by central banks from a few market participants,” adding that some are using reserves “to pay for increased energy and defense expenditure or to defend weakening currencies.”
The reason was immediate and existential: the Turkish lira. Since the outbreak of the Iran war, the lira has set 11 successive all-time lows against the dollar. According to BullionVault, Turkey held over 111 tonnes at the Bank of England, while Bloomberg reported that Ankara was exploring ways to tap its $135 billion gold reserve for lira defense.
Russia, Poland, and Ghana: The Selloff Spreads
Turkey was not alone. Russia raised approximately $2.4 billion from gold sales in January and February 2026, pushing its reserves to a four-year low. The proceeds went toward funding the ongoing war in Ukraine — a stark illustration of how geopolitical conflict converts long-term reserve strategy into short-term survival arithmetic.
Poland’s central bank governor Adam Glapiński was characteristically blunt. “Nobody’s stopping us from selling gold, taking a profit, and then buying it back some time later,” he declared publicly, proposing that profits from gold sales be redirected into defense spending. The proposal was reportedly rebuffed by Prime Minister Donald Tusk’s administration, but the signal was unmistakable: even NATO-allied central bankers are eyeing their gold reserves as a funding source for military budgets.
Ghana, too, trimmed its gold holdings to shore up liquidity. Steve Brice, Chief Investment Officer at Standard Chartered, summed up the dynamic: “Emerging market currency weakness has led some central banks to sell gold to stabilize currencies.” The pattern — sell gold, defend the currency, fund the war machine — was repeating across three continents.
From 1,237 to 750 Tonnes: The Structural Demand Decline
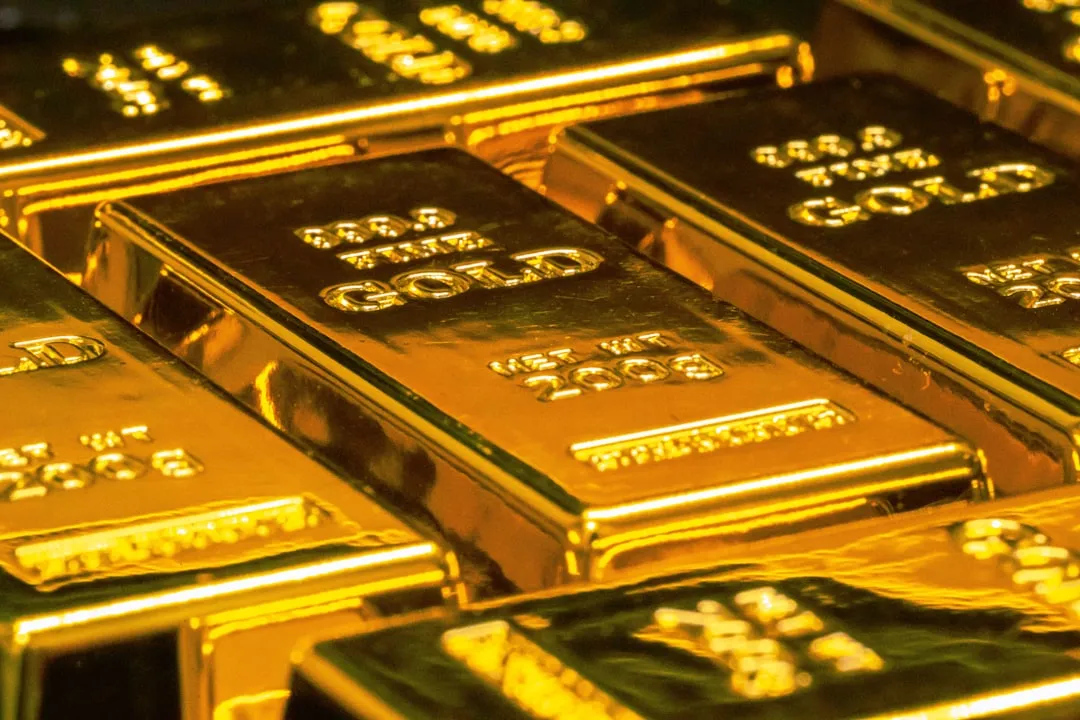
Individual country sales tell only part of the story. The aggregate numbers point to a broader structural shift. The World Gold Council (WGC) projects central bank gold purchases will fall to 750–850 tonnes in 2026, down from 1,237 tonnes in 2025 — a decline of roughly 35–40%.
Bernard Dahdah, commodities analyst at Natixis, warned that some central banks are selling gold to defend their currency or to fund energy purchases. He added that the gold price could come under downward pressure for the foreseeable future.
BullionVault data underscores the scale of the retreat. Central bank demand as a share of total net gold demand fell from a three-year average of 33% to below 25% in 2025.
For the gold market, the math is uncomfortable. Central bank purchases functioned as a structural price floor — reliable, price-insensitive buying that absorbed a third of annual mine supply. When that bid weakens by 35–40%, every other source of demand needs to step up proportionally to prevent price erosion.
$16.5B Wall Street Earnings Record Masks Dimon’s Warning
The East-West Split: China and India Buy While Turkey and Russia Sell
Why this matters: the central bank gold market is not simply shrinking — it is fracturing along geopolitical lines. China’s People’s Bank of China (PBoC) purchased approximately 290 tonnes in 2025, bringing its cumulative holdings to roughly 2,680 tonnes. India’s Reserve Bank (RBI) added 82 tonnes, pushing its total to 876 tonnes.
This divergence maps neatly onto the broader macroeconomic landscape. The BRICS+ bloc’s share of global gold reserves rose from 11.2% in 2019 to 17.4% in 2026. Meanwhile, Turkey, Russia, and Ghana are liquidating gold to pay for wars, energy imports, and currency interventions.
In other words, the East is stockpiling gold as a de-dollarization play while geopolitically exposed nations closer to active conflicts are converting gold to cash. This structural bifurcation makes the gold price’s directional signal far muddier than a simple bull-or-bear call can capture.
Gold Price Outlook: J.P. Morgan’s $6,000 vs. the Selling Pressure
Market strategists are as divided as the central banks they track. Natasha Kaneva, J.P. Morgan’s head of global commodities strategy, argued that the trends driving gold higher are not exhausted.
J.P. Morgan’s Q4 2026 average gold price forecast stands at $5,055, with a long-term bull case extending to $6,000. Kaneva added that official reserve and investor diversification into gold has further to run.
On the other side, Natixis’s Dahdah warned of “downward pressure for the foreseeable future.” The gold price currently sits at approximately $4,838, roughly 10% below its January peak. The market is pricing in a tug-of-war between structural bulls and tactical sellers.
The resolution depends on whether the selling is tactical — a temporary response to crisis-driven liquidity needs — or structural, reflecting a permanent reassessment of gold’s role in reserve management. If Turkey and Russia resume buying once their immediate pressures ease, the pullback becomes a buying opportunity. If the selling spreads to other emerging market central banks, it becomes a regime change.
De-Dollarization and Gold’s New Role: What Investors Should Watch
Despite the central bank selling, gold’s structural position in the global financial system continues to strengthen. The dollar’s share of global foreign exchange reserves has fallen from 71% in 2001 to 58% in 2026. Central banks are choosing gold as a hedge against single-currency risk, and the WGC’s latest survey found that 95% of central banks expect their gold reserves to grow over the next 12 months.
For individual investors, the signal is mixed but not bearish. Gold ETF holdings remain at an all-time high of 4,025 tonnes, suggesting retail and institutional demand has not cracked. Even with central bank annual purchases declining to 750 tonnes, that figure still exceeds the pre-2022 average of 400–500 tonnes per year.
Two indicators will determine gold’s next major move. The first is whether Turkey and Russia continue selling through Q2 2026 — sustained selling would confirm a structural shift, while a pause would suggest the March liquidation was an emergency measure.
The second is when China’s PBoC resumes public disclosure of its gold purchases. A resumption of transparent buying could catalyze the rally that J.P. Morgan’s $6,000 scenario implies.
China GDP Beats 5%, Auto Sales -11.8% Expose Demand Crisis
References
- Bullion Trading LLC (2026-01-26) — Gold hit $5,088, first time above $5,000; 64% gain in 2025
- Bullion Trading LLC (2026-01-26) — 2025 gold ETF inflows $89B record; ETF holdings 4,025 tonnes, AUM $559B
- Tribune (2026-04-15) — Turkey sold 131 tonnes in March; gold price down ~10% from peak
- BullionVault (2026-03-24) — Russia sold ~$2.4B in gold Jan-Feb; reserves at 4-year low
- BullionVault (2026-03-24) — Poland’s Glapiński proposes gold sales for defense; CB demand share 33%→25%
- OnlineGold/WGC (2026-02-15) — 2025 central bank purchases 1,237t; 2026 forecast 750–850t
- OnlineGold (2026-02-15) — China PBoC 2,680t cumulative; BRICS+ gold share 11.2%→17.4%
- J.P. Morgan Global Research (2026-04) — Q4 2026 target $5,055; long-term $6,000 possible
- OnlineGold/WGC (2026-02-15) — Dollar share 71% (2001) to 58% (2026); 95% of CBs expect reserves to grow
Stay Ahead of the Curve
Get the latest insights on AI, tech, and markets — delivered in both Korean and English.

Jugger | Backend Developer
A backend engineer working in enterprise solutions software since June 2021. The hands-on perspective from system design, API implementation, and production operations directly informs this site’s
AI, IT, and cloud infrastructure coverage.
For topics outside direct professional experience—blockchain and macroeconomics—analysis is built on primary-source citations such as SEC filings, whitepapers, institutional research, and government
statistics. Speculation is clearly separated from verified fact, and unverified claims are not published.
AI tools assist with drafting, but every article is reviewed, revised, and verified before publication. Errors are corrected with visible notes when discovered.
Contact: jjunggulee@gmail.com